Automotive aerodynamics: CFD results and mesh study.
Explore the aerodynamic flow around a DrivAer passenger-car model. Inspect streamlines, pressure-coefficient visualization, computational mesh resolution, and the drag-coefficient history—using the original simulation images and a new interactive plot.
How do the vehicle geometry and computational mesh affect predicted external-flow patterns and drag-related outputs?
System / operating scope
DrivAer passenger-car CFD configuration and selected simulated conditions.
Work performed
Prepared and examined vehicle geometry, local refinement around the wheels/mirrors/body, flow fields and drag history.
Analysis / input basis
External-flow CFD images and model setup as provided; the plotted drag history is an approximate digitization of a source screenshot.
Finding or displayed evidence
Original flow views show surface pressure, streamlines, wake and local mesh resolution; the displayed drag trace is an illustrative reconstruction, not raw time-series data.
Limits / validation status
Simulation-specific predictions. The reconstructed drag curve cannot independently establish numerical validation or exact coefficient time history.
Decision supported
Understanding external-flow behavior and model-resolution requirements.
Five interactive sections · all seven mesh renders retained
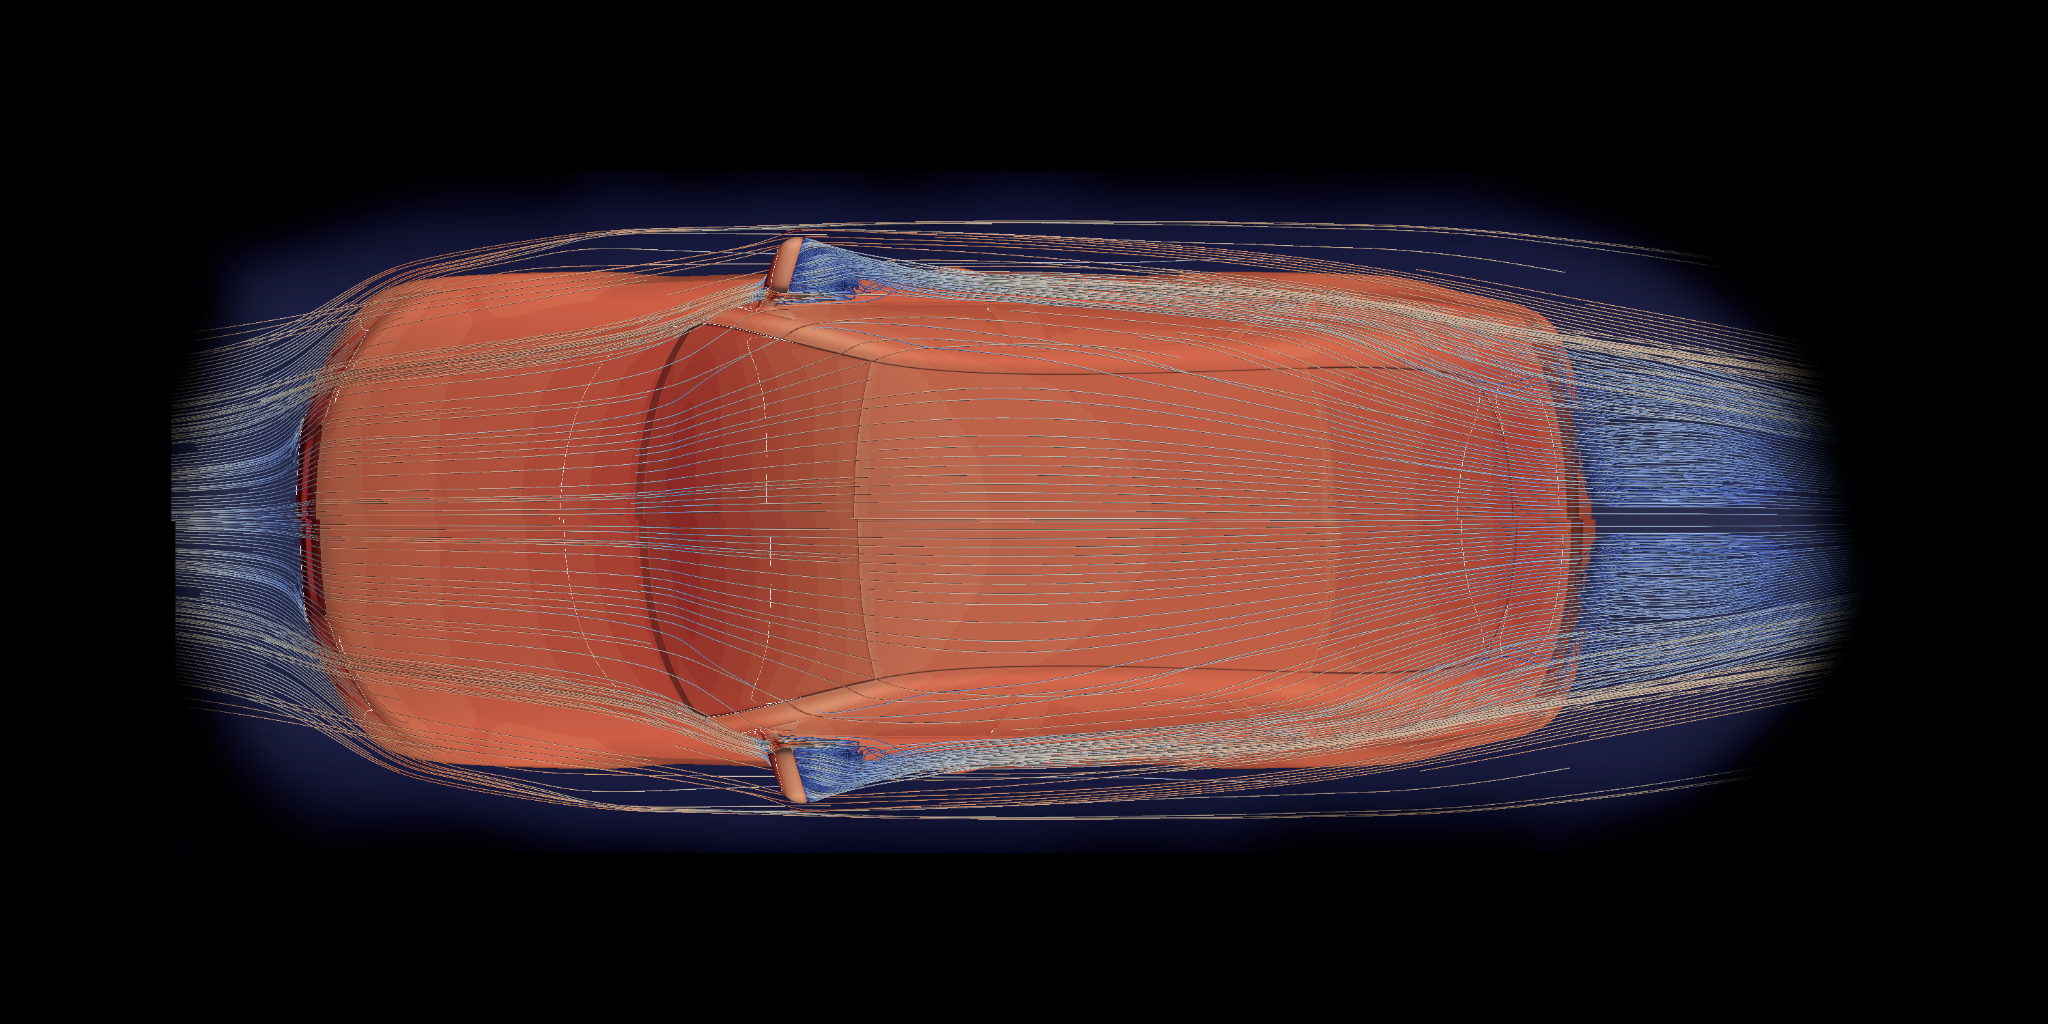
Vehicle streamlines · overhead
CFD / 3D STREAMLINES
FLOW / TOP VIEW
ORIGINAL CFD RENDER
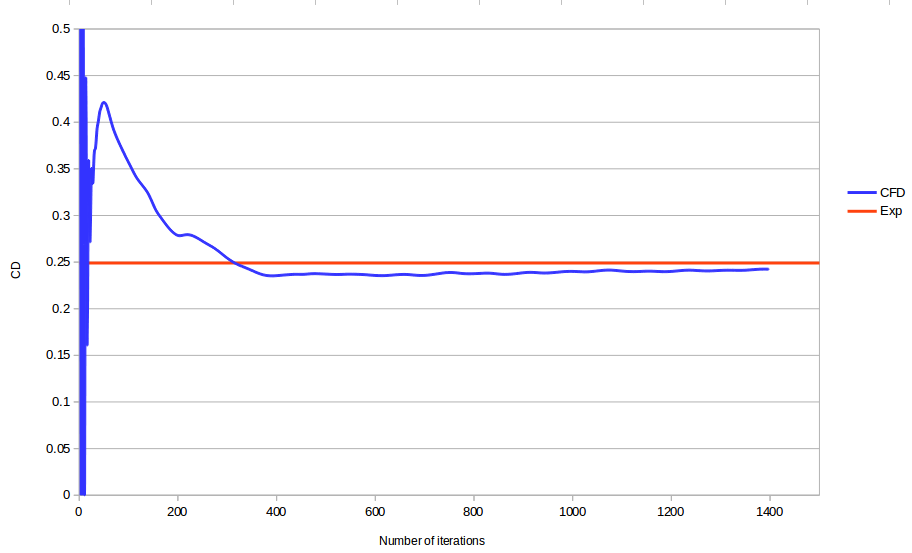
Drag coefficient convergence
CFD history vs experimental reference
CFD (digitized trace)Experimental reference
Graph digitized from the source image (first ≈25 iterations excluded); values are approximate, not solver exports.
All mesh visualizations7 distinct supplied renders · select to inspect
True aspect ratio · zoom + pan · arrow keys for fine positioning
02 / What the study demonstrates
Flow physics · verification · resolution
01 — FLOW STRUCTURE
Understand the external flow
Overhead and side views connect vehicle shape to local acceleration, flow deflection and the wake. Streamlines and surface Cp provide complementary qualitative information.
02 — FORCE PREDICTION
Trace the drag solution
The supplied history shows CD stabilizing toward an approximately constant value and compares it with a horizontal experimental reference. The interactive chart exposes the transient and late-iteration behavior.
03 — NUMERICAL RESOLUTION
Mesh difficult features
Full-vehicle and local mesh images highlight refinement near the body, wheel region, mirror and localized body details—where geometric complexity and flow gradients place demands on discretization.
Results, mesh and numerical setup
These original simulation views help communicate how geometry, mesh resolution and drag prediction relate. The recreated drag plot is an approximate digitization of a screenshot; it does not replace the underlying coefficient data or a documented validation study.
Scope of available evidence Neither the operating conditions nor a mesh-independence study, solver settings or experimental source documentation were included in this image set. Quantitative claims beyond the visible plot are intentionally limited.
CASE STUDY / TECHNICAL OVERVIEW
Automotive external aerodynamics CFD
Engineering problem
Assess how air moves around a vehicle and how local features affect the pressure and wake fields.
Work shown in this case study
This case study contains vehicle-geometry and mesh views together with interactive flow-field results. The material demonstrates practical CFD setup and interpretation for external vehicle flow.
How to interpret the results
Use the interactive figures to inspect computed flow structures and modelling details. Results apply to the geometry and simulated conditions shown in the study.