Underground station ventilation CFD.
Diesel exhaust dispersion inside an underground railway station. A CFD-led investigation into how heat, train position, extraction ducts and fan momentum affect the air people breathe.
Project study · OpenFOAM · Buoyant flow + pollutant transport
All displayed contours originate from the supplied engineering report.

Ventilation and contaminant distribution
Six configurations were evaluated in the report. Scrub through the scenarios and switch between horizontal breathing-zone sections and longitudinal plume views to see how the exhaust footprint changed.
Corrected central stopping position

Correcting upper-station pressure and openings did not prevent extensive pollutant spread with the locomotive stopped centrally.
Change the source location.
Change the occupied-zone outcome.
Drag the reveal control to compare a selected earlier configuration against the edge-locomotive result. All comparison strips were extracted directly from the report's original six-case montage.
Crucial distinction: the main duct extraction remains active in the recommended case. Only the nearest supplementary fan runs outward.

Comparison of the resulting flow fields
Examine the original final-case field outputs. Change pollutant or cross-section without distorting the spatial proportions of the CFD plots.
Nitrogen dioxide / breathing zone
Final edge-locomotive configuration · Z = 1.8 m
Full-scale station CFD model
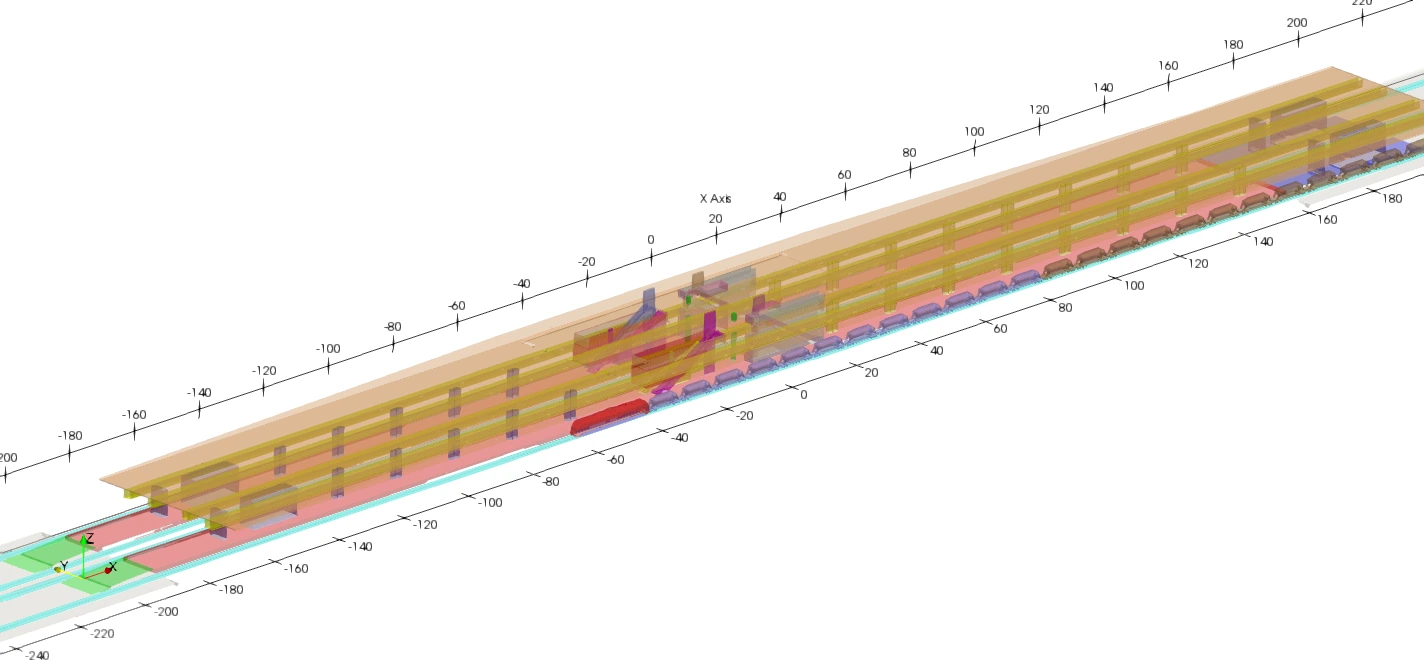
The computation includes platforms, the train, structural elements, extraction ducts, escalator connections and open station-end boundaries. Explore the actual model views taken from the report.
ENGINEERING SUMMARY
Project scope and interpretation
- Engineering question
- How do exhaust configuration and source position affect airflow and contaminant dispersion in an underground railway station?
- System / operating scope
- Approximately 415 m station model; six documented scenarios; modeled exhaust and ventilation conditions.
- Work performed
- Compared six airflow and source/extraction configurations using a large three-dimensional model with documented 21.64-million-cell production mesh.
- Analysis / input basis
- CFD flow and species-transport calculations with geometry, mesh and operating assumptions described in the original project material.
- Finding or displayed evidence
- The interactive viewer compares the modeled ventilation and contaminant fields, including an NO₂ plane at breathing-zone height in the final case.
- Limits / validation status
- Numerical scenario predictions, not direct personal-exposure measurements or evidence of regulatory compliance.
- Decision supported
- Comparison of ventilation/extraction arrangements and source positioning.
Geometry, meshing and transport modelling
The aim was to compare operational scenarios using resolved three-dimensional buoyant airflow and passive pollutant transport.
Station reconstruction
Long enclosure, outer-track locomotive, ventilation ducts, openings, and the exit region built from drawings and iterative clarifications.
Hex-dominant domain
blockMesh + snappyHexMesh with local refinement around the locomotive, duct openings and supplementary fan regions. Documented production mesh: 21.64 M cells.
Thermally buoyant RANS
OpenFOAM buoyantSimpleFoam with k–ω SST for steady velocity and temperature fields, including warm exhaust and ventilation momentum sources.
Four transport fields
Passive-scalar transport of CO, NOx, NO₂ and PM on the computed airflow; concentration fields compared against selected project thresholds.
“Better source positioning beat more fans.”
The strongest tested option moved the locomotive near the open station edge, retained the main duct extraction, and operated only the nearest supplementary fan outward.
Jet fans meaningfully improved plume directionality for central stopping, but residual pollutant hotspots remained. Source relocation reduced the long exposure path through the occupied station.
In the recommended case, most of the principal occupied zone fell below the selected project thresholds, while a localized exceedance remained near the locomotive exhaust source.
REVISIT CFD EVIDENCE ↑