WORKSPACE
Two interacting zones
The inner pipe and surrounding annulus create distinct flow paths with workers positioned at different elevations and radii.
4 + 4 workers
A three-scenario CFD investigation of airflow, heat and CO₂ transport around eight welders working inside a below-ground pipe installation — with the original simulation results available to explore.
ENGINEERING SUMMARY
Four welders operate inside the pipe and four in the annular space between the pipe and excavated earth. Ventilation, high-temperature welding sources and the underground geometry combine to produce a complex transport problem.
The inner pipe and surrounding annulus create distinct flow paths with workers positioned at different elevations and radii.
The original boundary conditions prescribe upward pipe flow and a split fan supply to the working zones.
Three cases examine the imposed air temperature and the presence or removal of wooden platforms.
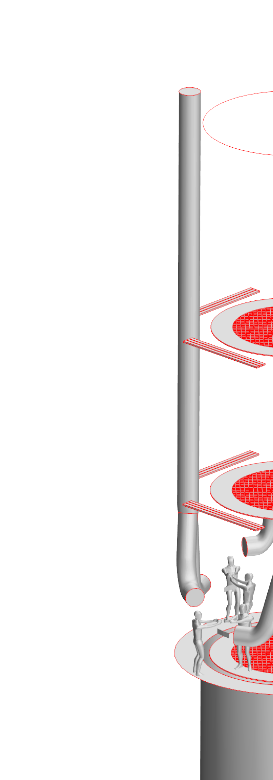
The simulation geometry captures the supply ducts, worker locations and perforated structures. Local mesh refinement resolves the narrow passages around perforated platforms.
 Source report · page 4
Eight worker locations are represented alongside the distribution ductwork, ring platforms and the central pipe. Earth wall and exterior pipe surfaces are suppressed in this source view for clarity.
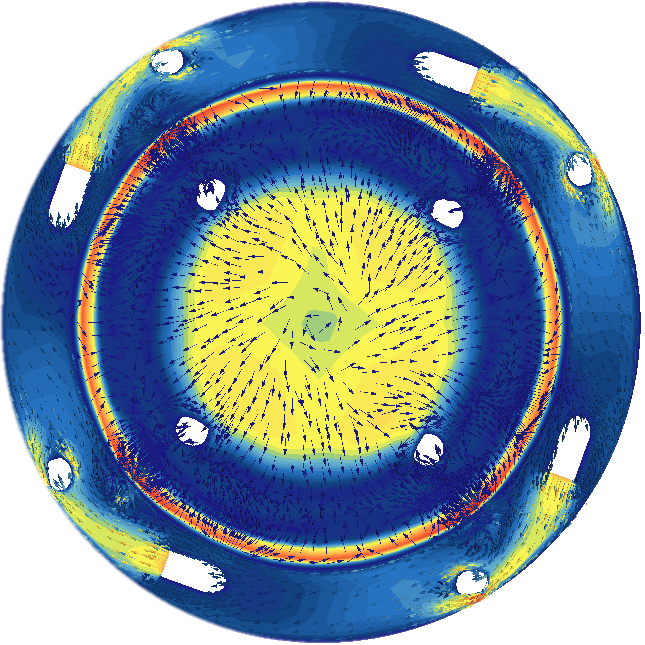
These are the original STAR-CCM+ simulation contours, extracted directly from the report. Change the scenario, physical variable and section plane, or compare matching results side by side.
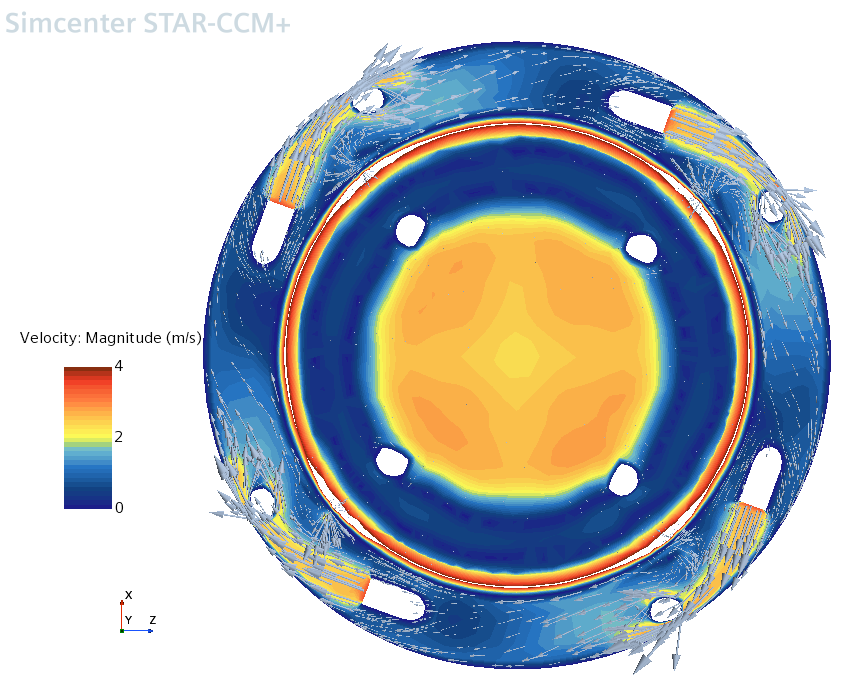
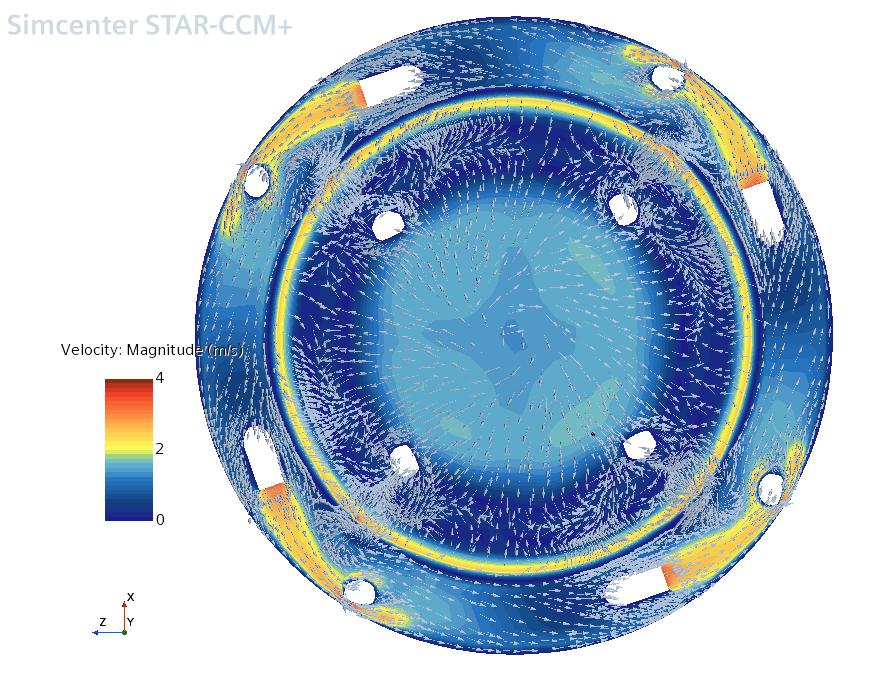
A curated selection from the full set of results. Every image links directly into the same interactive explorer, where the rest of the report's sections are available.
The section shows the velocity structure around the central pipe and the annular region, including high-speed zones and regions with weaker flow.
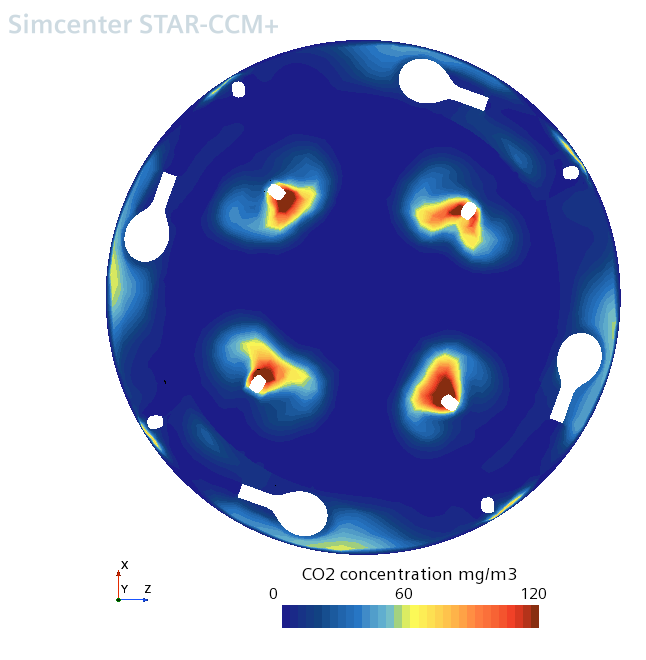
Localized peaks around the release points are visible at head height. The figure offers a spatial screening view, not a workplace compliance determination.
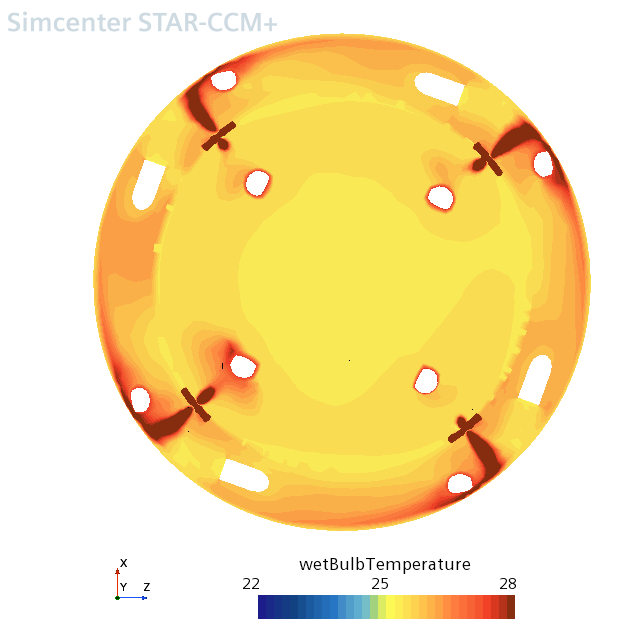
Wet-bulb temperature maps combine thermal and moisture effects in a working environment specified at 70% inlet relative humidity.
The report documents the same four physical fields across three specified scenarios. The first two vary supply temperature; the third retains 30°C inlet air while removing wooden platforms.
Initial airflow and thermal configuration with the platform geometry represented.
The prescribed air temperature increases from 27°C to 30°C with the platform configuration retained.
Wooden planks are omitted from the geometry to explore how a changed arrangement affects the predicted fields.
The study used steady-state, multicomponent CFD to examine ventilation and thermal conditions at multiple working-height planes, supported by localized mesh refinement.
Simcenter STAR-CCM+ was used for a steady-state, multicomponent flow simulation with the k–ω SST turbulence model. The mesh was refined in the vicinity of perforated structures, and results were sampled at waist, head, vertical, offset-vertical and upper cross-sections.
These visualizations identify predicted spatial patterns. The source document does not establish measured validation against on-site sensor data, exposure-duration statistics, or regulatory workplace safety certification. Therefore, this case study makes no numerical compliance or worker-safety claims.
Source fidelity. All sixty simulation views are extracted from the supplied PDF without redrawing contours, interpolating the solution or inventing transient behavior. The three hero thumbnails are crops of those same figures; the explorer retains the original legends and visual scale ranges.
The source report references a separate client-supplied boundary-condition document; any additional unreported assumptions or quantitative findings are intentionally omitted from this public-facing narrative.
CASE STUDY / TECHNICAL OVERVIEW
Examine air velocity, temperature-related conditions and transported contaminants in an industrial welding workspace.
The case study illustrates the computational domain, ventilation setup and comparison of working-condition scenarios for a welding installation.
Computed fields can identify flow patterns and regions of concern under specified inputs; they do not alone establish regulatory occupational exposure compliance.